Brand Tracking: Traditional vs TapResearch [+ Infographic]
4 minute read

Last week marked the 25th annual Sweets & Snacks Expo held in Chicago. Over 16,000 manufacturers, suppliers, retailers, distributors, and exhibitors gathered in the McCormick Place event center in Chicago to showcase & launch new product lines, network, deal, and learn.
To grasp the size and vibe of the event, here are a few pictures:
TapResearch had the opportunity to attend and our team met with many manufacturers, suppliers, and retailers.
While our friends at SPINS highlighted the trends they saw walking the show floor (TL;DR spicy flavors are in!), I wanted to briefly share some insight into the depth and context of the conversations our team was having and is having with brands during and after the expo.
There are two trends we noticed:
Many of the conversations I found myself in reminded me of a particular meeting during my tenure at the toy company Hasbro. The meeting was with one of the US Marketing leaders, responsible for deploying media budgets and driving sales growth for her brands. During the meeting, she walked me through her media spend report which displayed line items for TV spending by region. I was on the digital marketing team at the time and asked her a simple question, “How do you know if the TV spend is working?”. She looked at me, smiled, and pulled out another static piece of paper with her POS data mapped to the same regions. “Here. If sales go up in the regions we spend, then I know it’s working.” I laughed and said, there must be a better way to measure this that is not static pieces of paper. She shrugged her shoulders and we continued with the meeting.
Now, this conversation happened back in 2012. It is now 10 years later in 2022 and it is clear to me that as an industry, we still have a ways to go to help marketers more effectively measure their marketing and inform decisions.
The problem with POS data is that it’s a bottom-of-funnel lagging indicator. It helps marketers define “what” happened but it does not tell us “why” the sales occurred. My friend at Hasbro was using her media spend data (top-of-funnel) to help inform what was driving her sales velocity. But there is a large knowledge gap in the middle of this journey as seen in the image below.
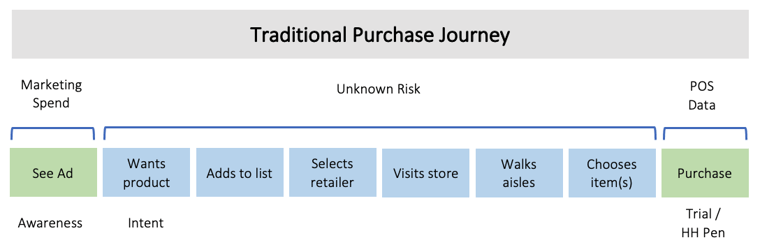
The moment after a consumer sees an ad (awareness) from a CPG brand, decides she wants it (intent) and makes the purchase (Trial or HH penetration). For the marketer, this long, unknown journey is full of risk, the risk of a competitor changing their mind, the risk of the consumer losing interest, or a slew of other factors as life passes her by.
To reduce this risk, we believe there are two actionable conversion points marketers can optimize for in addition to the traditional media spend (top) and POS data (bottom) funnel KPIs.
We believe that the marketer who understands these conversion points during the entire purchase journey will make better, more informed decisions. We also believe they should understand these conversion points at the brand level (e.g. Pepsi) and product-level (e.g. Pepsi Nitro) by region and demographics to be informed and make smarter marketing decisions, faster about how to grow their categories with confidence.
I had hundreds of conversations during the expo with senior marketing executives, category managers, and startup founders and I left the show feeling surprised that we haven’t evolved all that much since my conversations 10 years ago in a small cubical in Pawtucket, RI at the Hasbro HQ.
Luckily I now work at an innovative technology company called TapResearch that enables companies like King’s Hawaiian to understand the entire purchase funnel through access to over 20M everyday consumers and inform decisions on a weekly basis within a reasonable budget.
TapResearch provides marketers and researchers real-time actionable insights with easy-to-understand, shareable data. All at a fraction of the cost, resources, and time of traditional research methods. To learn more about high-frequency data and build your own specialized consumer survey, create your FREE account here or contact sales@tapresearch.com today.